As executive recruiters, we often get asked about executive compensation.
So often—after we finish up a search—we aggregate the compensation data we’ve collected across the search, and share it back with the innovation community. In this case, we recently finished a VP Engineering search for an early-stage Internet client located here in the Northeast in May, 2012. Note that there was a specialization required in this search requiring the VP Engineering to have prior experience with Ruby on Rails development environment.
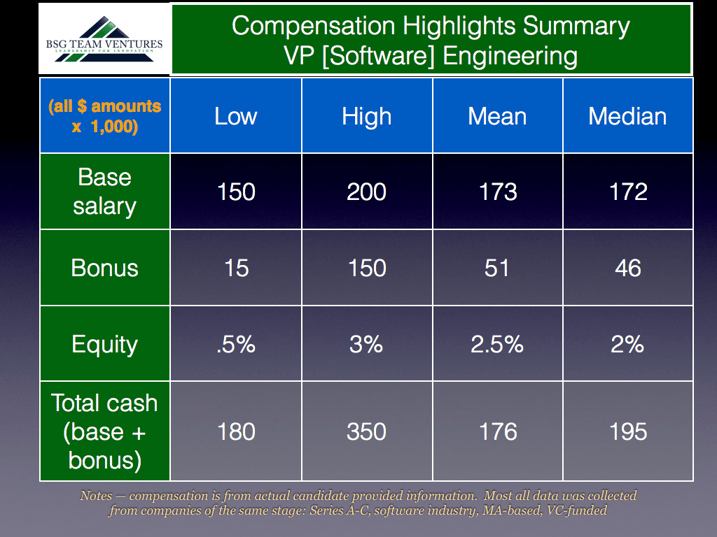
Here is the snapshot of compensation highlights from our search—
The footnote at the bottom of the image above articulates the following criteria for the majority of companies in this data set:
• Internet content/e-commerce providers
• Primarily B2C (business-to-consumer) focused
• This compensation data was specifically from those who had at minimum software development team responsibility that included all architecture, development, user interface & QA
• Although a number of these companies had venture capital/external funding, several were bootstrapped but still with engineering teams of more than 10.
• Companies were located in in the Northeast, with highest concentration in Massachusetts & New Hampshire (New England)
There are many variables to consider that influence where to pinpoint one’s own compensation vis-a-vis the above:
• The more urban locations, the more likely compensation will be higher
• The later the stage of company development, the lower the incentive compensation, the earlier the higher. Yes, this is counter-intuitive, but usually the larger the company, the more mature and capped the incentive compensation plans become
• Equity is represented here as a percentage of total outstandng stock options or share grants a company has issued or available. The more mature/de-risked a company, and the more recently an executive has joined, the lower the typical options grant.


