A recently completed search for a Chief Operating Officer for a private equity-backed, West Coast-based tech-enabled services company serving the construction industry presented the following executive compensation insights:
the Highlights:
- Title: Chief Operating Officer (COO)
- Ownership Structure: Investor-backed in Growth Mode
- Industry: Tech-Enabled Services, Construction
- Location: West Coast, USA
As executive search consultants, a by-product of our expertise is creating a wealth of knowledge on executive compensation.
When we complete an assignment, we aggregate the compensation data we have collected across the search, and share it with the executive talent community from which it came. In this case, in Q4 2019 we conducted a COO search for a private equity-backed company providing tech-enabled services to the commercial and residential construction industry.
To support our talent strategy, we focused on the target talent pool comprising those who either currently or in recent past roles held titles of COO, EVP, and a host of related senior operational roles.
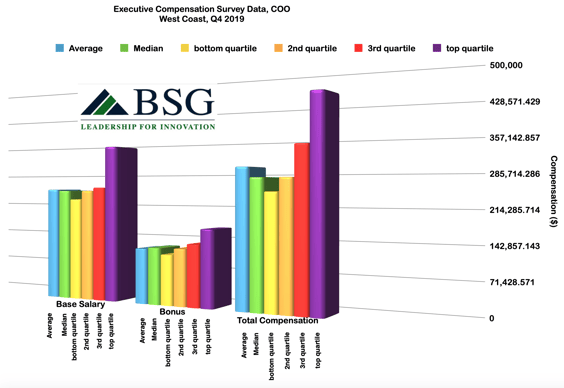
Executive Compensation Survey Data - COO, West Coast, Q4 2019
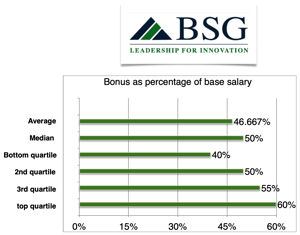
Bonus Structures:
As a percentage of base salary.
COO Executive Compensation Survey tabular Data:
| Base | Bonus | Total Comp | Bonus as % Base | |
| Average | 252,000 | 122,000 | 301,000 | 47% |
| Median | 250,000 | 125,000 | 280,000 | 50% |
| Bottom Quartile | 230,000 | 111,000 | 250,000 | 30% |
| 2nd Quartile | 250,000 | 125,000 | 280,000 | 50% |
| 3rd Quartile | 258,000 | 136,000 | 347,000 | 55% |
| Top Quartile | 350,000 | 169,000 | 451,000 | 60% |
Interested in more executive compensation highlights? Review our findings here and sign up for updates as we release new findings.