
A recently completed search for a Chief Financial Officer for a Boston-based publicly-traded (NASDAQ) biotech & life sciences company in the clinical stage of drug therapeutics presented the following executive compensation insights:
the Highlights:
- Title: Chief Financial Officer (CFO)
- Ownership Structure: Publicly Traded (NASDAQ)
- Industry: Biotech, Life Sciences
- Location: Northeast, USA
As executive search consultants, a by product of our expertise is creating a wealth of knowledge on executive compensation.
When we complete an assignment, we aggregate the compensation data we have collected across the search, and share it with the executive talent community from which it came. In this case, we conducted a CFO search for a publicly-traded biotech company in the clinical stage of drug therapeutics in the Northeast.
To support our talent strategy, we focused on the target talent pool comprising those who either currently or in recent past roles held titles of CFO, SVP, Finance Director and a host of related senior financial roles with specific experience in in clinical stage drug therapeutics and biotech.
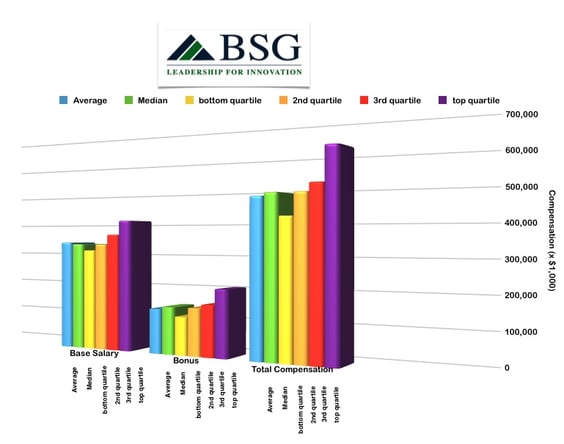
Executive Compensation Survey Data - CFO
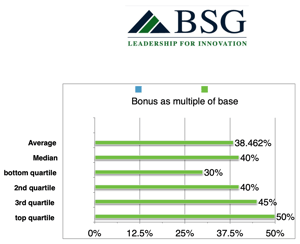
Bonus Structures:
As a multiple of base salary vs. as a fraction of base salary
CFO Executive Compensation Survey tabular Data:
| Base | Bonus | Total Comp | Bonus as % Base | |
| Average | 342,000 | 138,000 | 480,000 | 38% |
| Median | 337,000 | 146,000 | 490,000 | 40% |
| Bottom Quartile | 317,000 | 118,000 | 422,000 | 30% |
| 2nd Quartile | 337,000 | 146,000 | 490,000 | 40% |
| 3rd Quartile | 368,000 | 158,000 | 515,000 | 45% |
| Top Quartile | 412,000 | 206,000 | 618,000 | 50% |
Interested in more executive compensation highlights? Review our findings here and sign up for updates as we release new findings.