As executive recruiters, we are often asked about executive compensation.
When we complete an assignment, we aggregate the compensation data we have collected across the search, and share it with the executive talent community from which it came. In this case, in Q2, 2016 we finished a Chief Operating Officer/General Manager search for a growth equity SaaS software client located in Southern California.
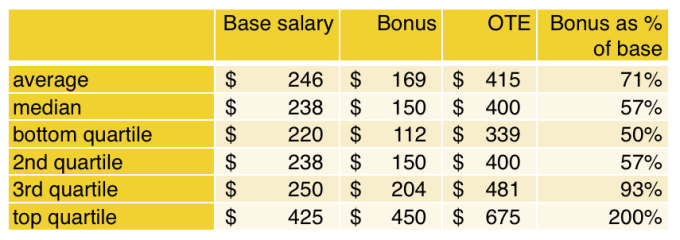
Our search strategy focused on the target talent pool comprising those who either currently or in recent past roles held titles of COO, CEO, General Manager, or EVP Sales & Marketing. The goal was to identify an executive who had extensive experience and a successful track record with investor backed companies, running the P&L as President, COO, EVP Sales, or similar who would be able to help scale the company beyond current ~$5M in revenues and EBITDA profitability, focusing on sales expansion, channel sales enablement, and operational efficiency. Below is the summary compensation data--

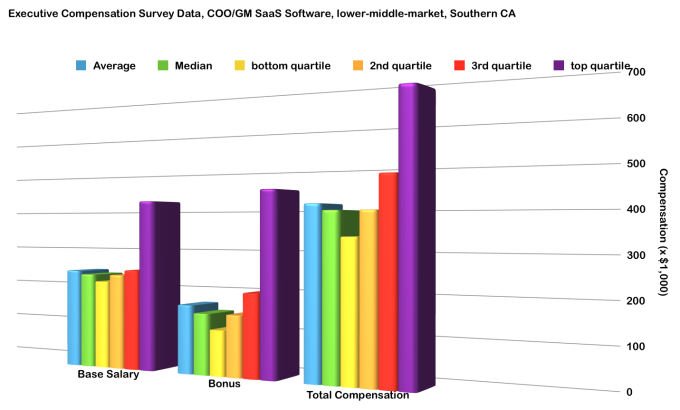
Graphing each compensation component of base salary, bonus, and OTE (on target earnings) this is what takes shape when you break it out into quartiles--

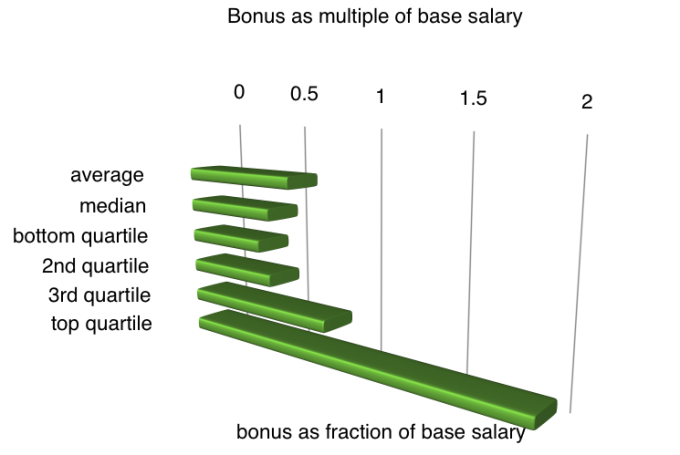
In looking at bonuses, it was interesting to ascertain bonus as a multiple of base salary. Below is what we found, again broken out into quartiles--

This data is relevant for either venture capital backed, or private equity-backed/growth equity-back SaaS software businesses that are profitable and with 15-100% annual top line growth rates. This particular client was a B2B software ISV.


