Every so often we do some analytics within the firm just to level-set on where we are. OK, in all honesty, we're very metrics-driven so it's probably more than "even so often," and it's also not a casual, anecdotal assemblage of loose stories and vignettes.
One of the topics we wanted to give greater scrutiny was how much of our practice in the last 18 months or so was for portfolio companies of private equity firms. And not only how much, but while we were at it, what geographies, and why not look at size of those private equity portfolio companies' revenues, and the industries in which they clustered?
That set us off to "cypherin'" as they say. Below are some of the results. Given that our roots 15+ years ago were in earlier-stage, venture-backed companies, it's an interesting diversification. For some, this may be intuitive. For others, they may wonder about whether leadership talent for venture capital is completely different than those executives we recruit for our private equity clients. The answer to that? It is still apples to apples, and not apples to oranges. Just a broader spectrum of apple varietals. When thinking about venture capital portfolio leaders versus private equity portfolio leaders, at their core (couldn't help the pun) they are still builder-leaders, which is the mantra for the type of talent we've specialized in a decade-and-a-half after founding the firm back in 1997.
While much has changed, this has remained a constant.
Stats below are based on some 40+ searches.
Enjoy.
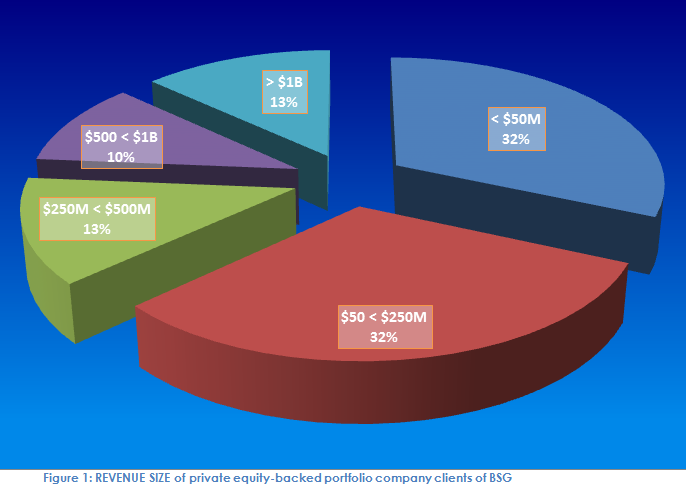
Our sweet spot over the last few years has been in the growth equity segment of the private equity investing thesis. That means more than half of all searches we've performed for private-equity backed clients have been for companies with revenues in the $25 million to $250 million range. The balance--about a third of private equity-backed company search work--was for companies with revenues about $250 million. These were sprinkled evenly across the $250 million - $500 milllion, $500 million to $1 billion, and great-than-$1 billion slices.
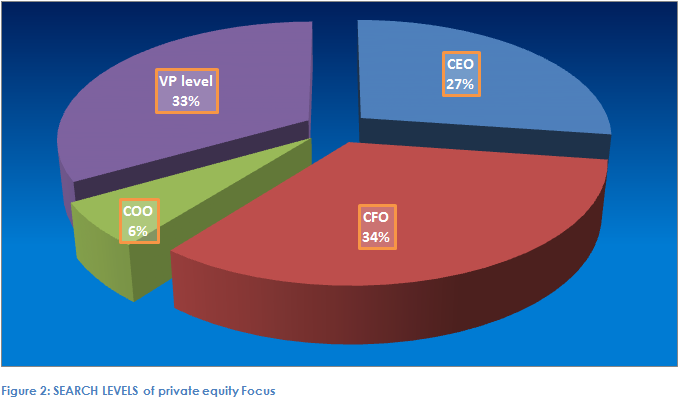
When we looked at the executive levels we had executed on behalf of our private equity-backed clients, a third of searches were for CFOs, 40% were for CEOs and COOs, and the balance of our search work was at the VP level, across the functional spectrum (see next graph for more detail on the VP-level exploded pie analysis).
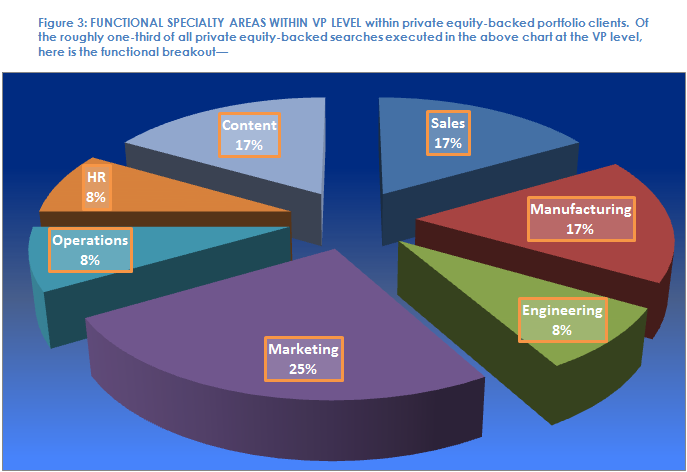
Search work for private equity-backed clients at the Vice President level distributed nicely over the organizational functional spectrum, including VP Sales, VP Manufacturing, VP Engineering, VP Marketing, VP Operations, VP Content (most in the education industry sector), and VP Human Resources.
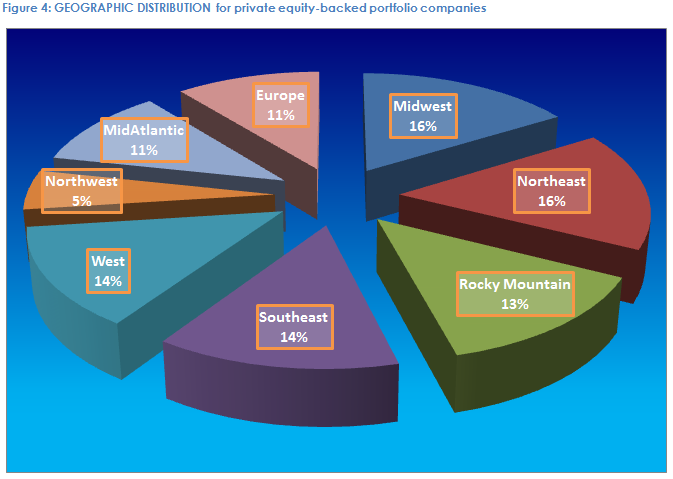
Finally, we looked at what party of the country (or globe) these searches clustered within, and the above graph portrays the distribution. Even we were surprised at this chart, as it shows an almost geographic-blind distribution--searches executed in all 7 regions in the U.S. (Northeast, MidAtlantic, Southeast, Midwest, Rocky Mountain, West & Northwest), along with an equal slice representing private equity-backed companies for whom we had done searches that were based in Europe (United Kingdom, France, and rest of West Europe).


